
Four Questions to Answer With Asset-Level Analytics
These days, there’s no lack of data. Teams have metrics coming at them from everywhere, all day long. But figuring out how to take meaningful action with the data you receive is a different story.
Google Analytics provides insights into website traffic, navigation, and conversions. Social media tools give you engagement and share data. But how are you tracking the individual assets that make up your content to ensure you’re getting the most out of everything you create?
Identifying key data points to measure the value of your assets will help teams prioritize their content efforts. And the data to do this is accessible in your digital asset management (DAM) platform. In fact, analytics is so pivotal to maximizing system usage, it’s one of the five foundations of DAM.
So let’s dig into some of the asset-level analytics available in your DAM solution by exploring four common questions teams are answering about their content using DAM analytics.
1. Are people using the asset we're spending money to create?
Creating marketing, product, and sales assets is time-consuming and costly. Multiple people are involved in planning, writing, designing, creating, and reviewing the assets for use. But simply producing something doesn’t guarantee its success. Asset-level analytics show what assets are being used and which ones aren’t. You can then use this information to focus your team’s time on the projects that produce the best results.
How to answer this question using asset-level analytics
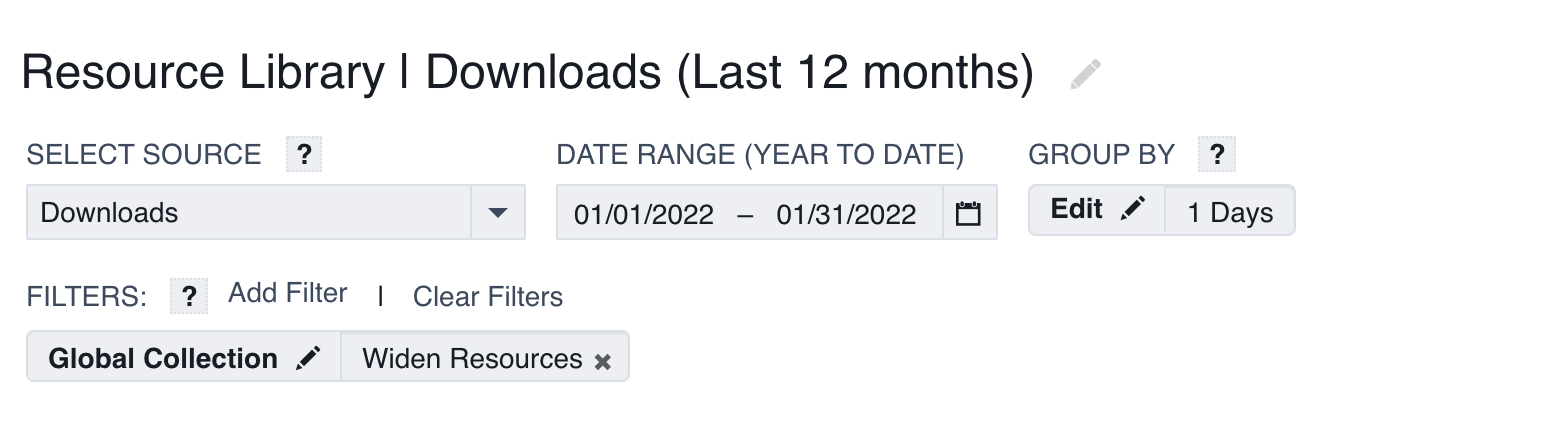
Start by looking at a subset of similar content. You can use your metadata and site structure to dive into content mediums, topics, and styles. For example, we have a resource library on our website that’s home to many PDFs and infographics to help visitors learn about DAM. Those assets are located on the same page, so they’re on a fairly equal playing field to be viewed, shared, and downloaded.
We've added this curated set of assets to a collection in our DAM platform, Acquia DAM, for easy referencing and measuring within the Insights app but you can also analyze each asset individually via Quick Insights.
To get started, create a new report in Insights using a filter for your global collection and any other parameters for groupings and date range. We’ve embedded links for these assets within the Resource Library so we’re looking to see how often each resource is downloaded via the embed links.
Look at the results. What’s being used the most? What about the least? Are these numbers in line with the performance you’d planned for these resources?
Possible actions
If an asset is falling short, do some probing to understand why that might be before just writing it off. Perhaps it needs additional internal promotion so teams know it exists. Or maybe it’s a great resource but the copy on the form isn’t enticing downloads as hoped. Try A/B testing some new copy on the gated form to see if that might help. Then incorporate your learnings into future content.
2. Which photographs are getting used the most?
Photographs are used in many different ways. From website images to social media posts and a lot of projects in between. But what images are resonating most with your teams and audience?
Using asset-level analytics to look at individual and groups of photographs stored in your DAM system will indicate which assets are being used the most and for what reason. (You can determine the reason by turning on the Intended Use feature to capture how users plan to use the assets they download or share.)
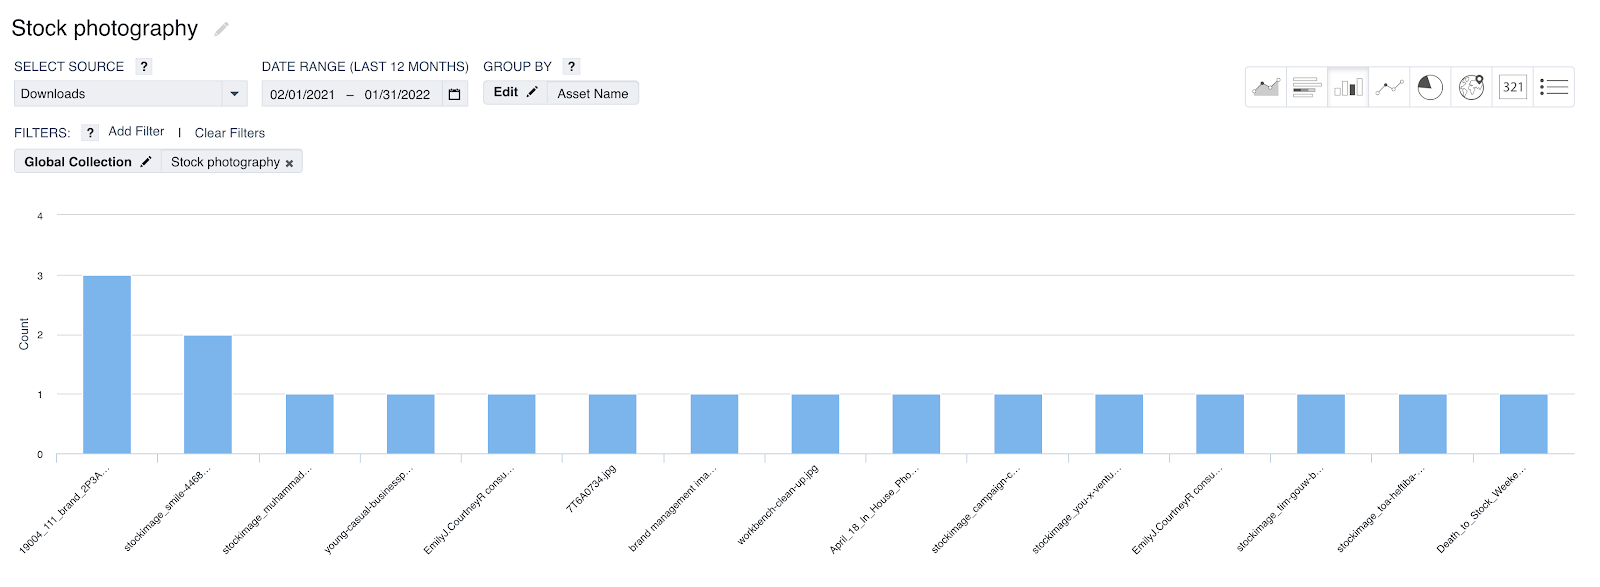
How to answer this question using asset-level analytics
Start a report in Insights to look at downloads. This can then be curated to view all or a subset of photography content using asset groups, categories, collections, metadata type, or file and format type, depending on your system setup.
This will allow you to see downloads of your photography, including counts and asset details. These details can also be exported for additional filtering and sorting.
Possible actions
Now that you know what photography is being used the most, dig into it further to understand why. Maybe there is a certain photography style or photographer that’s being used more. Can you take a look at your content plan armed with this knowledge? Perhaps lifestyle shots are being used more. Or maybe your customers just want clear product shots? Getting the data is just the first step. Keep asking questions to get to the “why” of your results and that will help you determine what actions to take next.
3. What content is being shared the most?
Your buyer and customer-facing teams play a key role in educating external audiences. The back and forth dialog these teams have with the intended audience gives them insight into when to share what. Use these conversations and take a look at what content is already being shared with your audience to help inform what information your audience really wants.
How to answer this question using asset-level analytics
Create an Insights chart to look at views and filter to the specific content you want to review. We’re looking at our resources, which are all in one collection for just this reporting purpose. Selecting “views” as your source will provide details around how people saw these assets which includes share links, embed views, portal views, and more.
Navigate to a curated collection of resources designated for a specific audience and filter by share views. If the resource is intended to be downloaded and used, compare the ratio of share link views to downloads. This gives you an idea of how often your audience is actually putting that piece to use.

Possible actions
Exporting the details of this report will allow you to sort and filter your results by view type. From there, you can start looking at how people are — or maybe aren’t — interacting with your photography assets. This should help to provide a jumping-off point for next steps which could include repurposing assets for new content, retiring assets, or adjusting your content strategy to incorporate learnings from this reporting exercise.
4. Are people finding these assets?
As a digital asset administrator, you’re responsible for helping your users find the assets they need. Take a look at the site views to see if people are finding key assets in the DAM system. This can include views from asset details page (site views), downloads, embed views, share views, and more.
How to answer this question using asset-level analytics
Choose an individual asset to review, click on it and pull up Quick Insights. Does the asset have the view counts you’d expect? How are people getting to this asset? Is it in the way you anticipated they would? Is that must-have asset being used as much desired based on the resources that went into it?

Possible actions
As with all data, it’s not just all about the numbers. There isn’t a magic cut-off that makes this process cut and dry. Asset performance is best determined by reviewing a range of content over time to understand how it works as part of your whole strategy.
Once you’ve collected enough data to understand your baseline, take a look at what might be impacting performance. See what information is on the asset details page and if it needs to be added to or updated. Review which departments are using the asset the most. Or maybe it’s a certain region that’s getting more from it. You could then speak to the department or region to find out why that asset is so popular — or not so popular. Then take this information to help inform your content strategy.
Even more DAM analytics
Asset-level analytics are a great way to dig into the performance of specific assets, but they’re only the beginning. Interpreting and acting on DAM analytics is both an art and a science. Once you have the hard data, it’s time to piece together the whole story. Only then can you take meaningful action to optimize your DAM and content strategy.
Learn about the other important DAM metrics that can be used to measure content performance and discover how Acquia DAM Insights can help. You can also try out Insights for yourself in the free trial of Acquia DAM.
Note: This article was originally published on Widen.com.

Manager, Product Marketing Marketing Acquia

